About this website
This app provides an interactive platform for
exploring and downloading mapped global
fishing effort data.
Users can filter by
year, country, gear
type, vessel length, sector,
Exclusive Economic Zone
(EEZ), and FAO
statistical area
using the selection sidebar in each tab.
This latest version of our mapping methodology
integrates country-level fishing effort estimates with
a statistical spatial allocation model using random forest modeling.
The industrial model is built using AIS-derived fishing activity
from
Global
Fishing Watch
, while the artisanal model is built using
vessel detections from Sentinel-2 from
Global
Fishing Watch
and vessel detections provided by
Skylight
(via Minderoo Foundation). We combine environmental, economic,
and governance variables with the AIS and vessel detections
to predict fishing effort globally.
For each fishing country, we trained a
two-stage hurdle random forest model
to predict the spatial distribution of fishing effort:
- The first stage predicts whether fishing
occurs in each grid cell globally from 1950-2017.
- The second stage estimates the intensity
of fishing effort in each cell globally from 1950-2017.
By multiplying the predictions from both stages, we
obtain the estimated fishing intensity
(the proportion of a country's total fishing effort
) in each cell where fishing is predicted to occur.
These estimates are then scaled to
kW days of fishing effort
using total fishing effort values (or number of vessels for artisanal) from
Rousseau et al. 2019
(Figure 1).
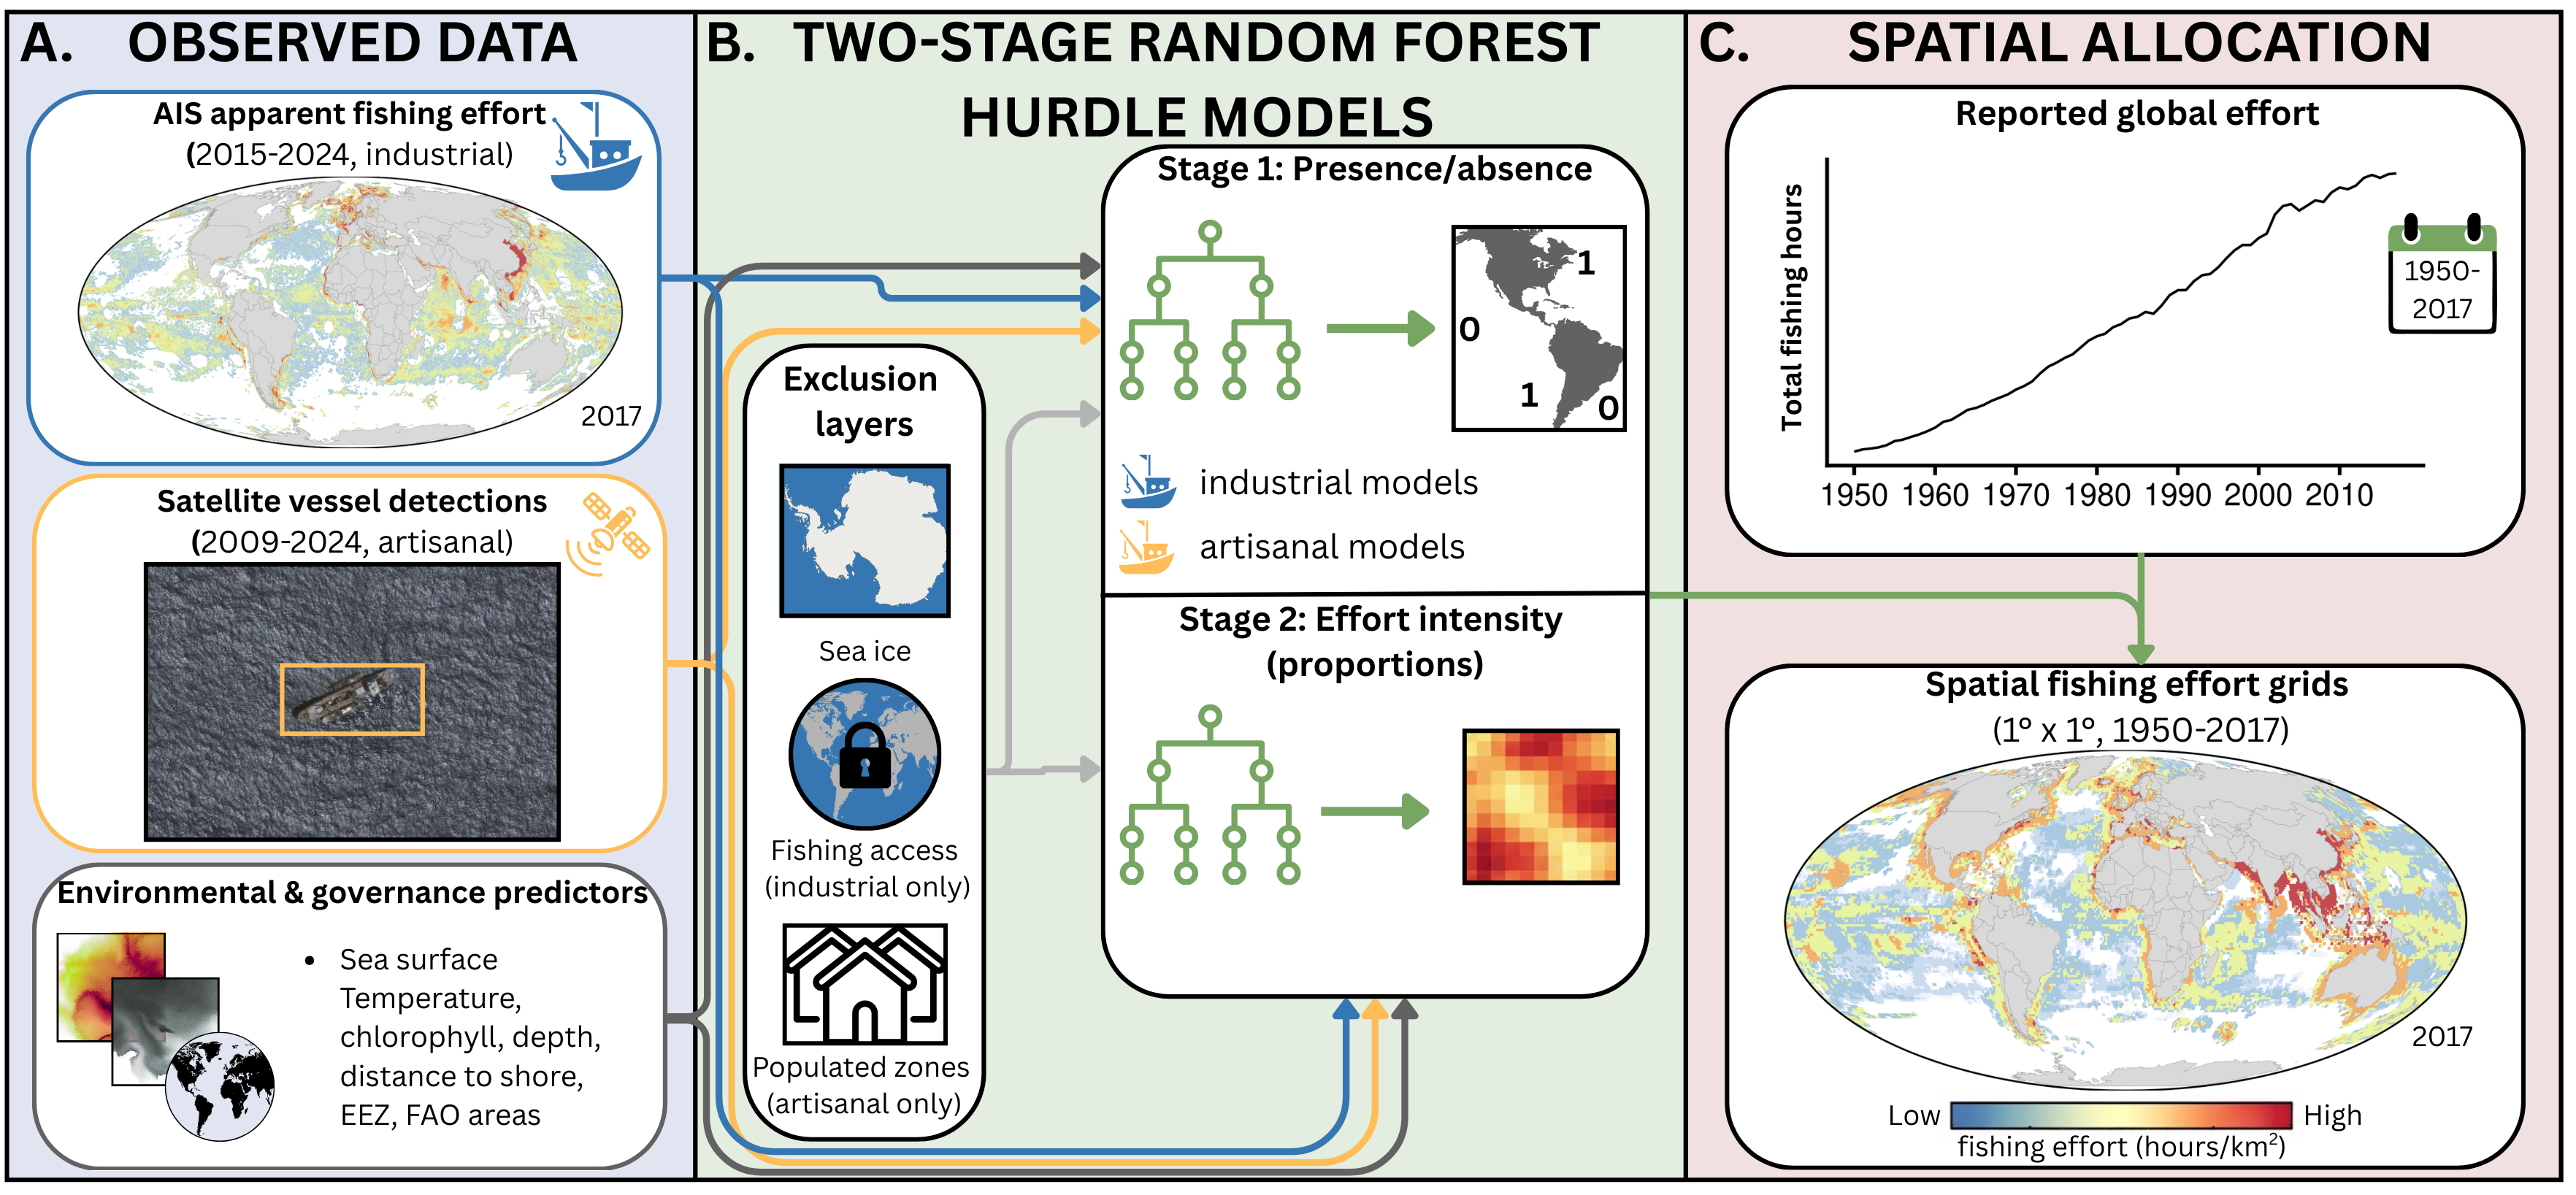
Figure 1:
Schematic overview of the two-
stage random forest hurdle modelling and spatial
allocation workflow. (A) Observed inputs used to
train models, including AIS apparent fishing effort
for industrial fleets (2015–2024) satellite-based
vessel detections for artisanal fleets (2009–2024)
and environmental and governance predictors (e.g.,
sea-surface temperature, chlorophyll, depth,
distance to shore, EEZ/FAO regions). (B) Two-stage
hurdle models: Stage 1 predicts fishing
presence/absence, and Stage 2 predicts relative
effort intensity (proportions), with exclusion
layers applied as appropriate (e.g., sea ice;
industrial fishing-access constraints; artisanal
populated/coastal zones). (C) Model predictions are
then used to spatially allocate reported global
fishing effort totals to produce annual gridded
fishing-effort surfaces (1° × 1°; 1950–2017).
Icons adapted from Canva.com.
Mapped effort estimates are provided as nominal
fishing effort (kilowatt days) or effective fishing
effort (kilowatt days), with a spatial resolution of
1° cell (industrial) and 0.5° cell (artisanal),
spanning the years 1950-2017. To estimate
effective effort, Rousseau et al. 2019 have assumed a year-on-year
increase in technical efficiency of 3.5%, as in
Rousseau et al. 2019.
This app and the underlying data was created, and is under continuous
development by Gage Clawson, Camilla Novaglio &
Julia Blanchard from the Institute for Marine &
Antarctic Studies (IMAS), University of Tasmania.
Caveats and limitations
This data is likely not comprehensive and represents modeled outputs only. For example,
estimates in Southeast Asia, aside
from China, are likely too concentrated for some years (e.g.,
Indonesia). This is an artifact of insufficient AIS
data in this region.
Additionally, users should be aware that historical
predictions (1950-2014) may not capture:
- Technological changes in fishing capabilities
- Evolution of fishing strategies and practices
- Changes in management regulations
- Shifts in target species or fishing grounds
due to socio-economic factors
Rousseau et al. 2024 Data Tab
The
'Rousseau et al. 2024 data' tab
provides access to an independent dataset of mapped
global fishing activity from
Rousseau et al. 2024
: "A database of mapped
global fishing activity 1950–2017". This dataset
represents a previous spatial allocation of
fishing effort data that is different from the modeled
estimates shown in the other tabs.
The Rousseau et al. 2024 dataset offers additional
grouping options including functional groups, allowing for detailed analysis of fishing
patterns by different fleet characteristics. Users
can explore this data by individual flag country,
with the same temporal coverage (1950-2017) and
location filtering options (EEZ and FAO areas) as
the other tabs. Unfortunately, the mapped data (with latitude and longitude points) for the Rousseau data
is too large to add to this shiny app, however, this data can be accessed via the IMAS data portal here:
https://data.imas.utas.edu.au/attachments/1241a51d-c8c2-4432-aa68-3d2bae142794/
How should I use this tool?
This app has three tabs that allow you to visualise
and download fishing effort data:
-
The 'Map' tab
allows you to explore spatially explicit
industrial effort data globally and for a
selected region (EEZ or FAO statistical area).
You can also specify the year (between 1950
and 2017), flag country (e.g. Angola, Albania
, Argentina), sector (industrial or artisanal),
gear type (e.g. bottom trawling, longline),
and vessel length category (less than 6m,
6-12m, 12-24m, 24-50m, over 50m) you are
interested in exploring.
-
The 'Time series' tab
gives you
the same options but allows you to explore
trends in fishing effort across both industrial
and artisanal sectors combined.
-
The 'Rousseau et al. 2024 data' tab
provides access to an independent dataset with
additional grouping options including functional
groups and sectors, allowing for detailed
country-specific analysis.
How should I cite data from this site?
You can download the data used to create the plots
shown in this interactive tool using the 'Download'
button included under each tab. Additionally, all
model data is available via zenodo and our GitHub
repository.
As a condition of this tool to access data, you must
cite its use: Clawson, S.G., Novaglio, C., &
Blanchard J.L. (2025). Global Fishing Effort Model
Data and Shiny App:
10.5281/zenodo.15110744.
How can I contact you?
If you have any ideas on how to improve this app or
if you found any issues, you can "create an issue"
in our
GitHub repository.
For general enquiry we can contact Julia Blanchard
at
julia.blanchard@utas.edu.au
Acknowledgments
The development of this app was funded by the Food
and Agriculture Organization of the United Nation
(FAO) and the Minderoo Foundation. We would also like to acknowledge the use of
computing facilities provided by Digital Research
Services, IT Services at the University of Tasmania.